Interactive Zooming Spectrograms Demo - The Navigation and Visualisation of Environmental Audio using Zooming Spectrograms
Other figures that are a part of this publication include: Figure 1 - Top, Figure 1 - Mid, Figure - 4 (Focused stack), and Interactive zooming demo
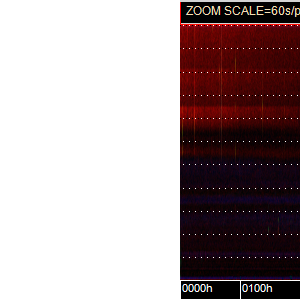
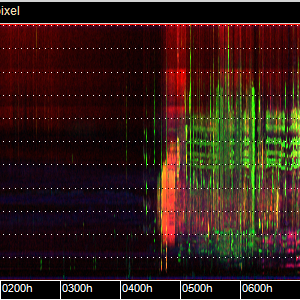
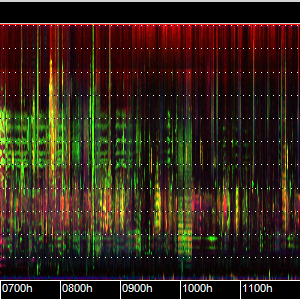
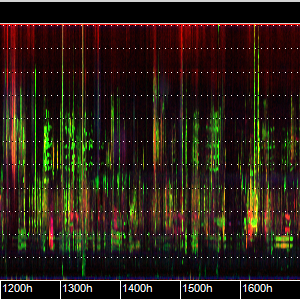
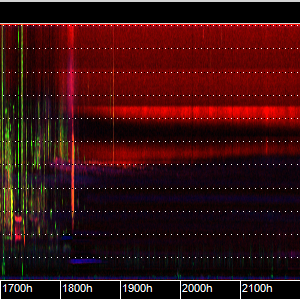
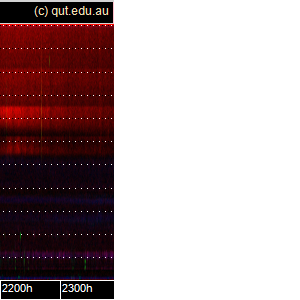
An acoustic day in the life of the Australian bush as revealed in a series of zoomable false-color spectrograms. The transition from layer 8 (0.2s/px) to layer 9 (0.1s/px) is the transition from false-color BGN-POW-CVR spectrograms to the pseudo-color cubehelix representation. An non-interactive, cropped, version of this image is at http://www.ecosounds.org/Zoom/4.
A note to the reviewers: The host for the tiles changed their public API on the 24th of July 2015. This resulted in the demo being broken for two days until the 26th of July 2015 when it was updated and repaired. Additionally it seems our host is suffering from intermittent performance problems - if the tiles are loading slowly please try again later.
Interactive Zooming Spectrograms for a Recording from the 13th of October 2010
Axes: The x axis time scale varies from small-scale (top) to large scale
(bottom).
The scales shown are: 60, 24, 12, 6, 4, 2, 1, 0.6, 0.4, 0.2, 0.16, 0.08,
0.04, 0.02 seconds/pixel. The horizontal grid-lines are at 1 kHz
intervals.
Zoom functionality can be controlled with the scroll wheel on a mouse.
Please note zoom is focused on center of control (not mouse).
Panning can be done by clicking and dragging the image.

