Figure 4 - The Navigation and Visualisation of Environmental Audio using Zooming Spectrograms
Other figures that are a part of this publication include: Figure 1 - Top, Figure 1 - Mid, Figure - 4 (Focused stack), and Interactive zooming demo
A sequence of fourteen images from smallest scale (top) to largest scale (bottom) focused on minute 60 (7am). Three-color mappings are used to cover the 11.6 bit scale gap: ACI-ENT-EVN at the smallest scales, BGN-POW-EVN at the mid-scales and the BGN-POW at the large scales (see table).
|
|
Color mapping |
||
|
Scale |
Red |
Green |
Blue |
|
Small |
ACI |
ENT |
EVN |
|
Mid |
BGN |
POW |
EVN |
|
Large |
BGN |
Cube-helix color-scale POW |
|
A focused stack of false-color spectrogram with varying resolutions.
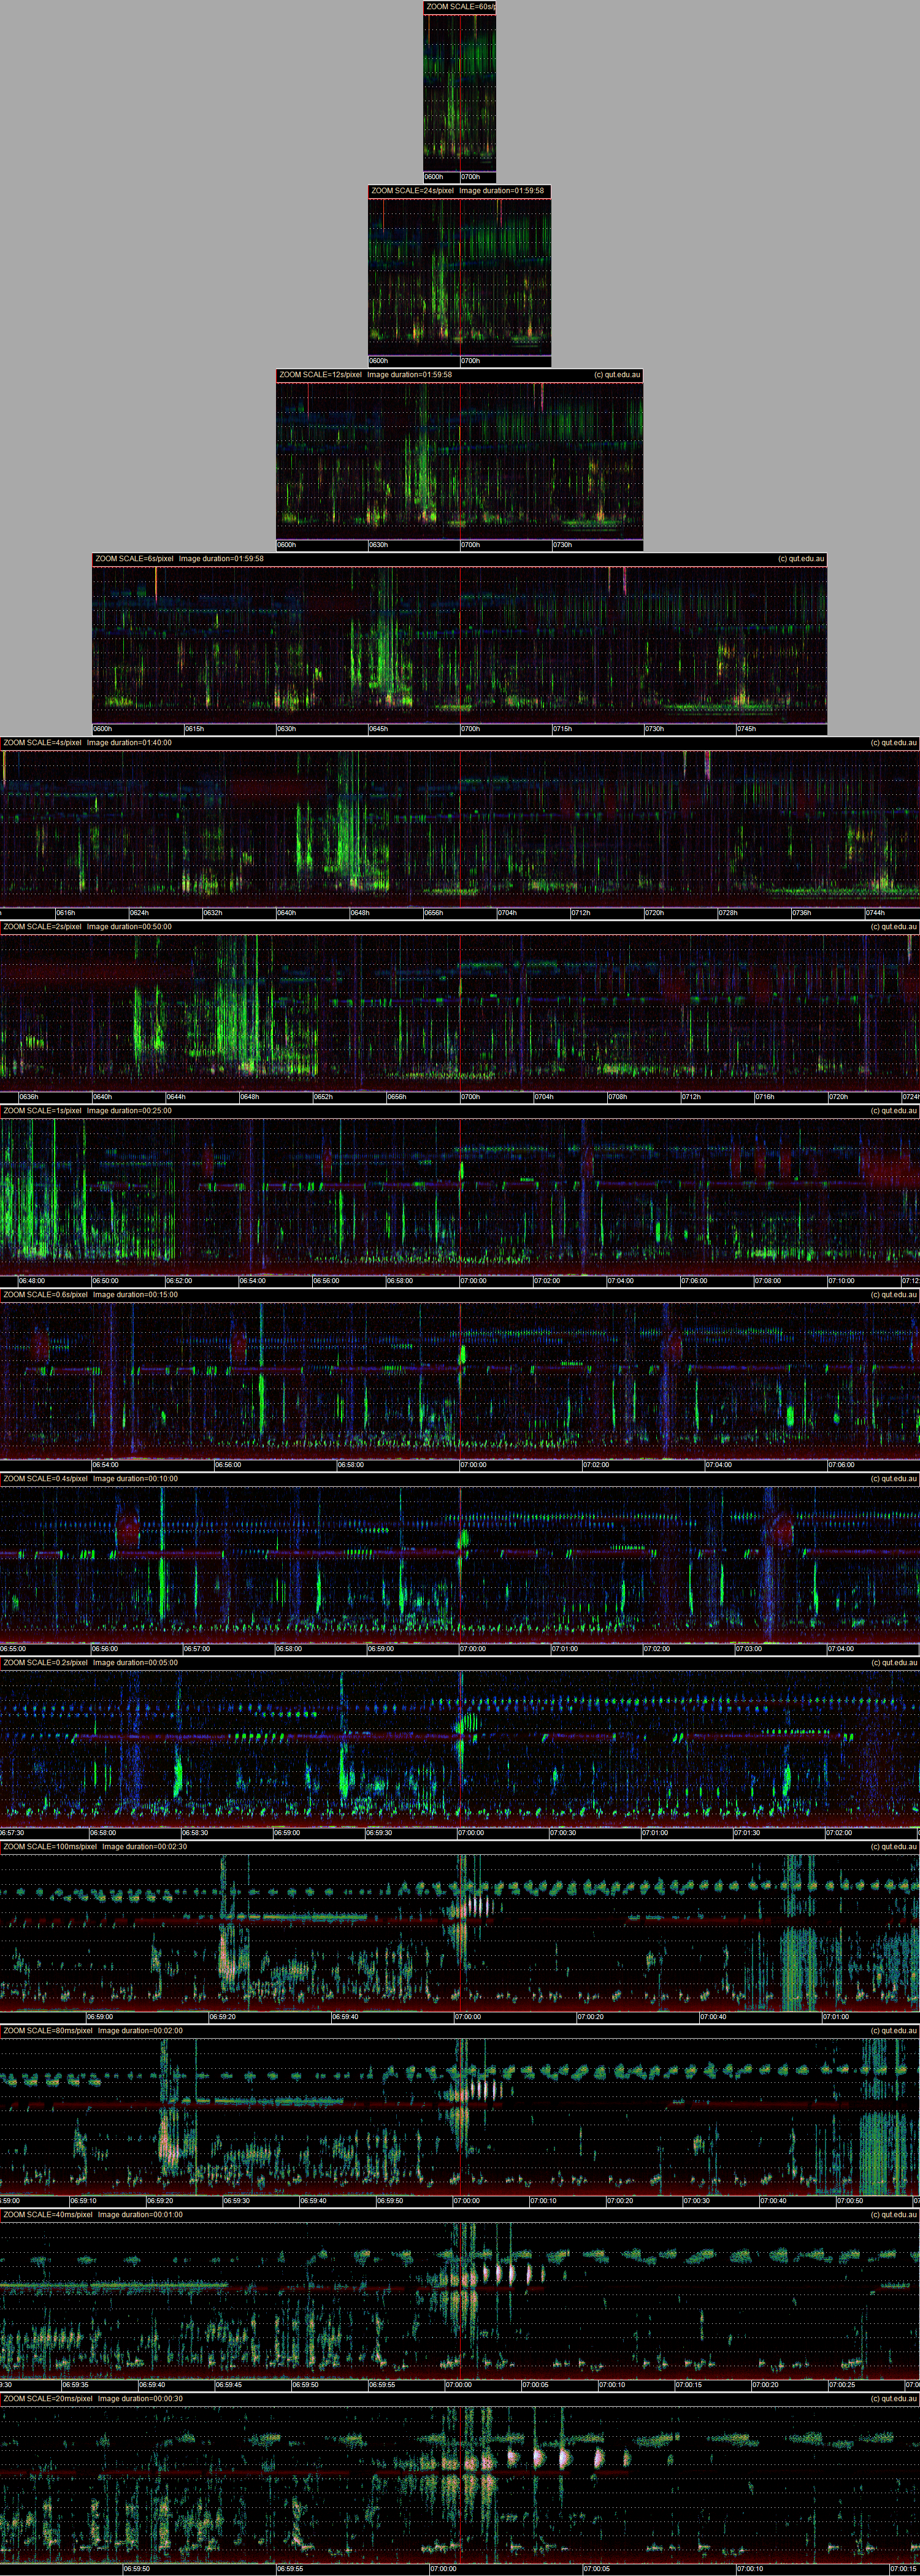
Axes: The x axis time scale varies from small-scale (top) to large scale (bottom). The scales shown are: 60, 24, 12, 6, 4, 2, 1, 0.6, 0.4, 0.2, 0.16, 0.08, 0.04, 0.02 seconds/pixel. The horizontal grid-lines are at 1 kHz intervals.